
By: Lauren R. Hawley, GMU Student Contributor
When considering the flaws in our projections and models, it can be tempting to throw up our hands and side with David Hume, who famously reasoned that “the supposition that the future resembles the past, is not founded on arguments of any kind, but is derived entirely from habit.” Of course, the past is the only tool we have to make predictions or preparations of any kind, which we desperately need, ironically especially in times of uncertainty and change. The best we can do is adjust and assess our imperfect models, and build them better next time.
It is difficult to imagine a more important, or more challenging, subject of modeling than climate change and energy use. This paper analyzes differences between projections in the 2015 and 2021 Annual Energy Outlook (AEO) prepared by the Energy Information Administration (EIA)[1], specifically the “Residential Sector Key Indicators and Consumption” projections. The following indices were visibly different in the two reports, and were therefore selected for further examination: household energy intensity, ratio of single family to multi family homes (calculated from two separate indices), square footage, and heating degree days. A wide variety of factors are at play, exacerbating and offsetting one another. Many of these drivers are considered below, though limitations in time, scope, and expertise will leave many more uncovered.
The first index considered is household energy intensity. Household energy intensity represents energy use per square meter of housing space, a ratio designed to account at least in part for factors like household size and socioeconomic differences (Goldstein et al. 2020). As demonstrated in Figure 1, 2021 projections for energy intensity are noticeably higher than are projections from 2015 (EIA, 2015, 2021a). The EIA suggests that much of this change is due to an increase in work from home and videoconferencing sparked by COVID-19, an increase that is temporarily offset by economic decline caused by that same pandemic (EIA, 2021b), though presumably recent reductions in employment serve to increase energy intensity as well (Cicala, 2020). This reasoning is supported by research by the National Bureau of Economic Research, which shows that this uptick in residential energy use is atypical of economic downturns, and results, at least in part, directly from the rise in virtual work (Cicala, 2020). I would argue, however, that the pandemic has accelerated the development of industries and infrastructure that support increased residential power even outside of working hours. Suddenly there are home delivery and curbside pickup options for everything from gourmet meals to craft supplies, teladoc appointments are readily available for physical and psychological ailments, and online classes remain popular even as restrictions on in person learning begin to lift. These conveniences, alongside telework, enhance quality of life for many even outside the context of the pandemic, and appear to be here to stay.
The second index analyzed here is the ratio of single family to multi family homes. This is not an index directly provided by the EIA; the EIA does, however, provide a projection of total single family and multi family households, which were used to generate the index. Figure 2 displays the resulting data, which show a visible decrease in projections for the ratio of single family homes to multi family homes for the first decade of projection, followed by an increase in the ratio from 2015 to 2021 projections starting in 2031 (EIA, 2021; EIA, 2015). Decreases in the ratio in the near future may result from economic downturn, given the relative inelasticity of demand for multi family housing (Colonomos, 2020), as well as from the so-called “COVID baby bust” (Kearney & Levine, 2020), given that families without children are more likely to live in multi family homes (Solomon, 2017). Meanwhile, the relative uptick in demand for single family houses starting in 2031 may be due to increased access to virtual work, which allows relocation away from urban centers to areas where single family housing is more affordable, especially once the economic decline ends (Tetz, 2021). This would also explain higher average house square footage projections, displayed in Figure 3, which are consistently higher in 2021 than 2015 (EIA, 2015, 2021a). The lack of lag given the current economic downturn could perhaps be explained by the greater ease of relocation for renters, allowing them to move to similar housing in slightly more affordable areas (Tetz, 2021).
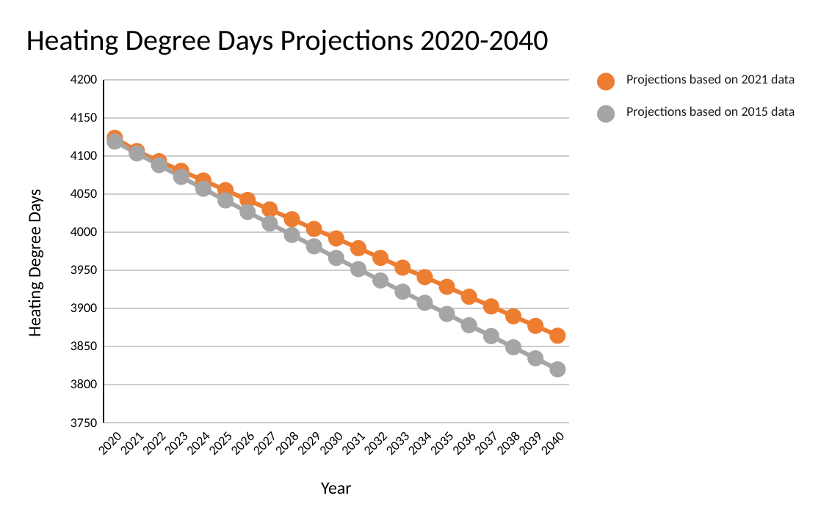
The fourth and final projection compared here is the number of heating degree days, or days that average temperature falls below 65 degrees Fahrenheit (NOAA, n.d.). The data, visualized in Figure 4, show that projections have increased from 2015 to 2021 (EIA, 2015, 2021a). One possible culprit is recency bias, given that it has been particularly cold this winter (Ricker & York, 2021). Another, more sobering explanation is that worsening climate change projections may be at play, given that rising global temperatures may be indirectly causing an increase in extreme cold events in North America (McGrath, 2021).
The vast complexity of economic and environmental modeling leaves many openings for error, despite the vast collection of human knowledge and historical data involved in the process. Our models are limited by our assumptions, our imaginations, and our experience. While we cannot achieve perfection, we can continue to strive for utility and improvement.
This essay is part of Paul Bubbosh’s course, Introduction to Energy Law.
References
Bhattacharyya, S. C., & Timilsina, G. R. (2009, March). Energy Demand Models For Policy Formulation. The World Bank.
Cicala, Steve. (2020, October). Powering Work from Home. NBER.
Colonomos, B. (2020, June 26). Multifamily Remains Strong Amid Health And Economic Uncertainty. Forbes.
EIA. (2021). Annual Energy Outlook 2021: Table: Residential Sector Key Indicators and Consumption.
EIA (2021, February). Assumptions to the Annual Energy Outlook 2021: Residential Demand Module. EIA.
EIA. (2015). Annual Energy Outlook 2015: Table: Residential Sector Key Indicators and Consumption.
Goldstein, B., Gounaridis, D., & Newell, J. P. (2020). The carbon footprint of household energy use in the United States. Proceedings of the National Academy of Sciences, 117(32), 19122–19130.
Kearney, M. S., & Levine, P. (2020, June 15). Half a Million Fewer Children? The Coming COVID Baby Bust. Brookings.
McGrath, M. (2021, September 2). Climate change: Arctic warming linked to colder winters. BBC News.
National Oceanic and Atmospheric Administration (NOAA). (n.d.) What Are Heating and Cooling Degree Days.
Ricker, C., & York, S. (2021, October 25). EIA forecasts U.S. winter natural gas bills will be 30% higher than last winter. EIA.
Solomon, A. (2017, September 14). Adults Who Opt Not to Have Kids Cause Ripple Effects in U.S. Housing Market. Washington Post.
Tetz, K. (2021, December 16). Real Estate Analysis: COVID-19’s Impact on Migration, Rent Costs, and Lifestyle. Moss Adams.
Figure 1
Household Energy Intensity Projections: 2018-2040
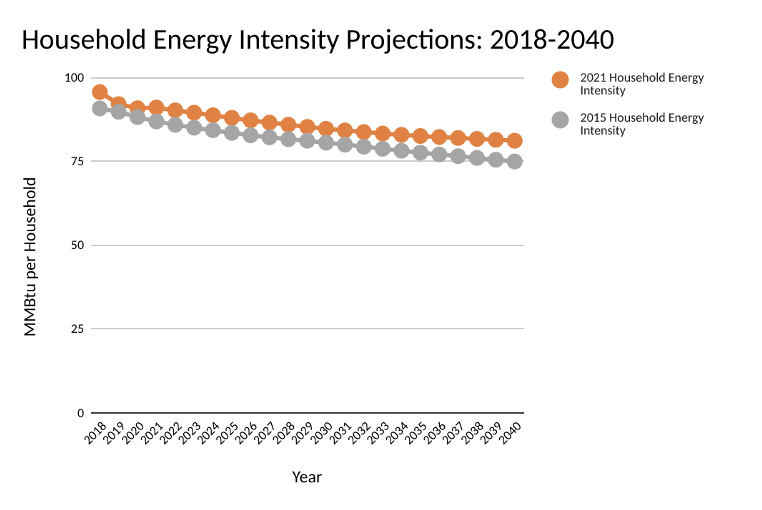
Figure 2
Ratio of Single Family to Multi Family Households: 2018-2040
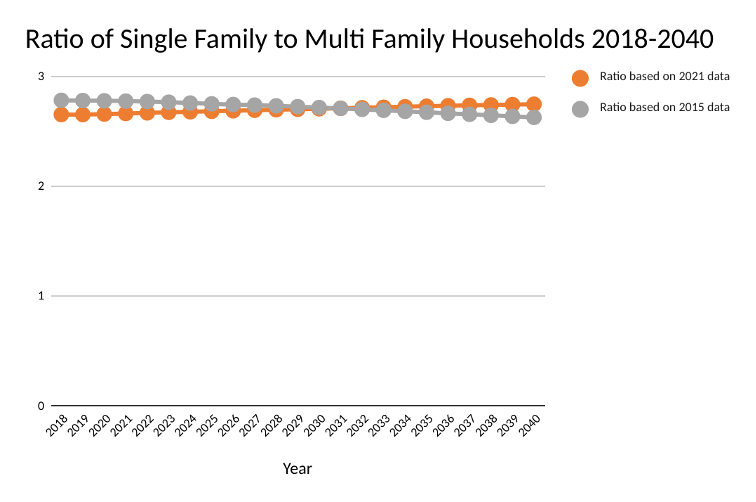
Figure 3
Average House Square Footage Projections 2018-2040
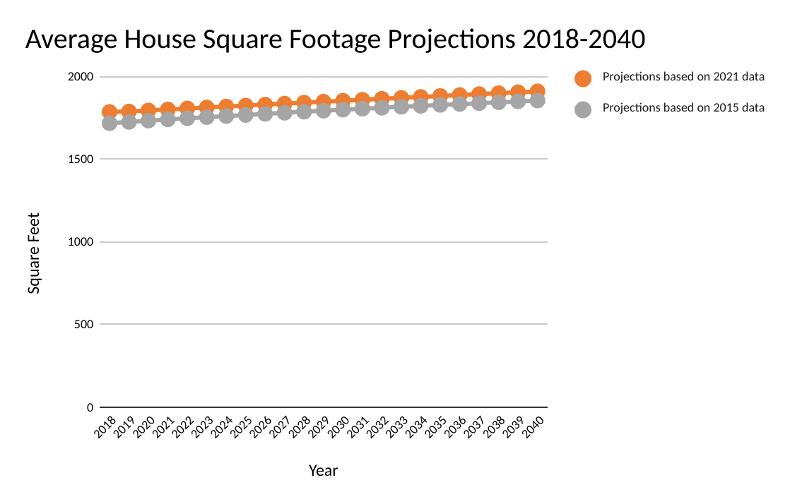
Figure 4
Heating Degree Days Projections 2020-2040
[1] This paper is in response to an assignment to compare EIA data across different time periods, and was selected as an exemplary paper in the course, Introduction to Energy Law, EVPP 505-202/POGO 750-021.
Image: Wikipedia.com, logo of the U.S. Energy Information Administration